
Reports and analytics
The reporting suite — sales, items, customers, staff, KOT, coupons, credit, purchases and wastage.
Food Magic's reporting suite covers sales, products, people and procurement. It's made up of one Overview dashboard, plus a separate, focused report for each area.
What it is
There are thirteen report screens plus one dashboard-style Overview screen. You reach all of them from Reports in the sidebar. This page gives a quick overview of what each report shows and who can see it. It isn't a detailed, field-by-field guide to any one report — a deeper page for each report is planned separately.
- Outlet-level staff who hold a reporting permission can use this — typically owners and managers. Three screens — Staff Attendance, Payroll, and Staff Report — each need a narrower permission than the rest of the suite, so fewer people can see those than everything else. Waiters and delivery riders can't see any of it.
- You'll find it in the Reports section of the sidebar: one Overview dashboard, plus thirteen individual report screens.
- This feature is live. There's one small loose end, noted under How it works below. It isn't a security issue — just unfinished wiring.
How it works
The Overview page (/reports)
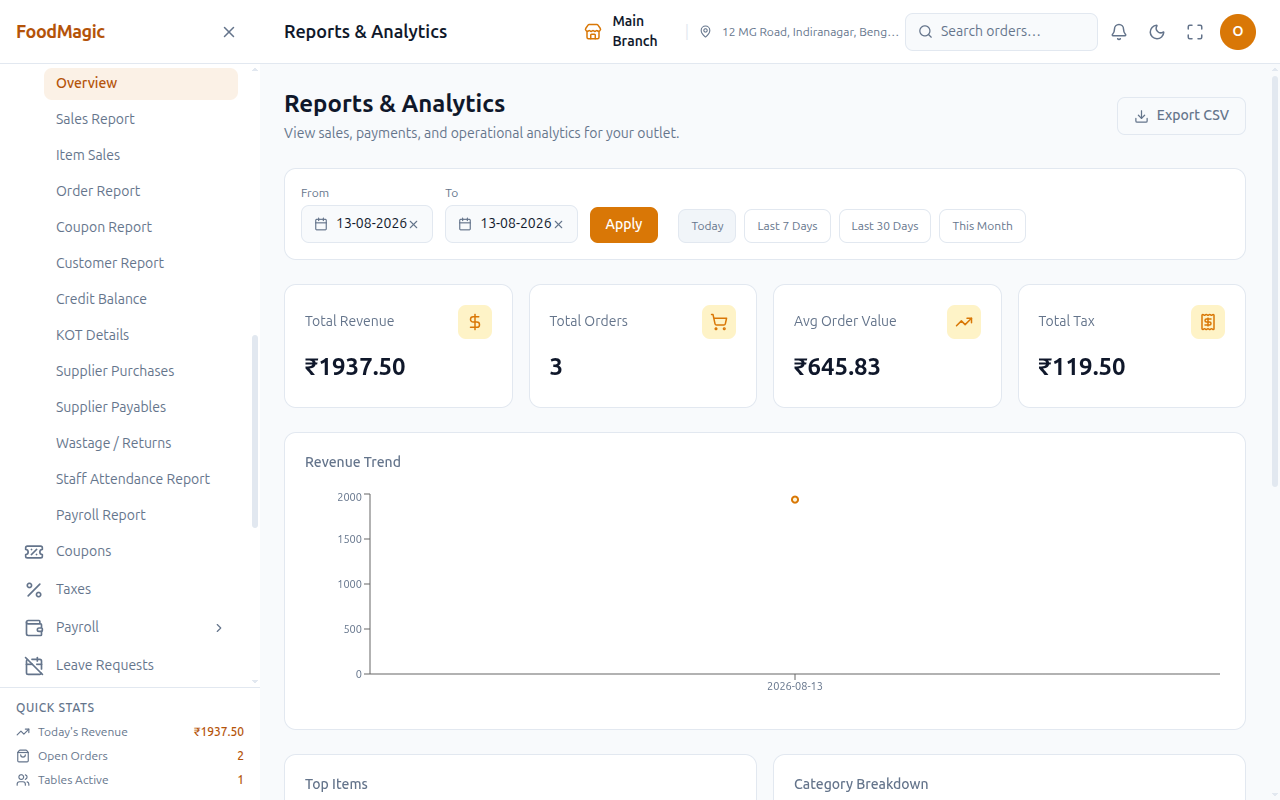
The Overview page is what you see first when you open Reports from the sidebar. It's a dashboard of charts, not a table. It shows headline KPI cards, a daily sales trend, a top-items bar chart, a category-breakdown pie chart, and an hourly heatmap. All of these update together based on one shared date range.
Pick a From and To date, then click Apply. Or use a one-click shortcut instead — Today, Last 7 Days, Last 30 Days, or This Month. A shortcut fills in the dates and re-runs the charts right away. You only need to click Apply after typing in a custom date range.
The KPI cards, the daily trend line, the top-10 items bar chart, the category pie chart, and the hourly heatmap all update together for whichever date range you've selected.
An Export CSV button shows up only for users who hold the export permission. More on this below.
Export CSV
There's exactly one export button in the whole reporting suite, and it's here on the Overview page. None of the twelve individual report screens has its own export button.
Click it and you get a CSV file of the order ledger for whichever date range the Overview page is currently showing. Each row is one order, with its order ID, type, status, payment status, amount, tax, discount, and when it was placed.
The file downloads directly rather than opening in a new browser tab, because the export needs you to be logged in to work.
This button does not export whatever report you happen to be looking at. It always pulls the raw order ledger for the Overview page's own date range. Use it for reconciliation, or whenever someone needs that period's orders in a spreadsheet.
Exporting has its own separate permission, kept apart from the permission that lets someone view the reports at all. Being able to read the reports and being able to take the data out of the system are treated as two different things. An admin can grant one without the other, from Roles & Permissions.
The reports
Sales
| Report | Screen | What it answers |
|---|---|---|
| Sales Summary / Trends / Hourly Heatmap | /reports (Overview) |
Headline totals and movement over time |
| Sales Report | /reports/daily |
Day-by-day trading |
| Order Report | /reports/orders |
A searchable order ledger |
Sales Report — /reports/daily
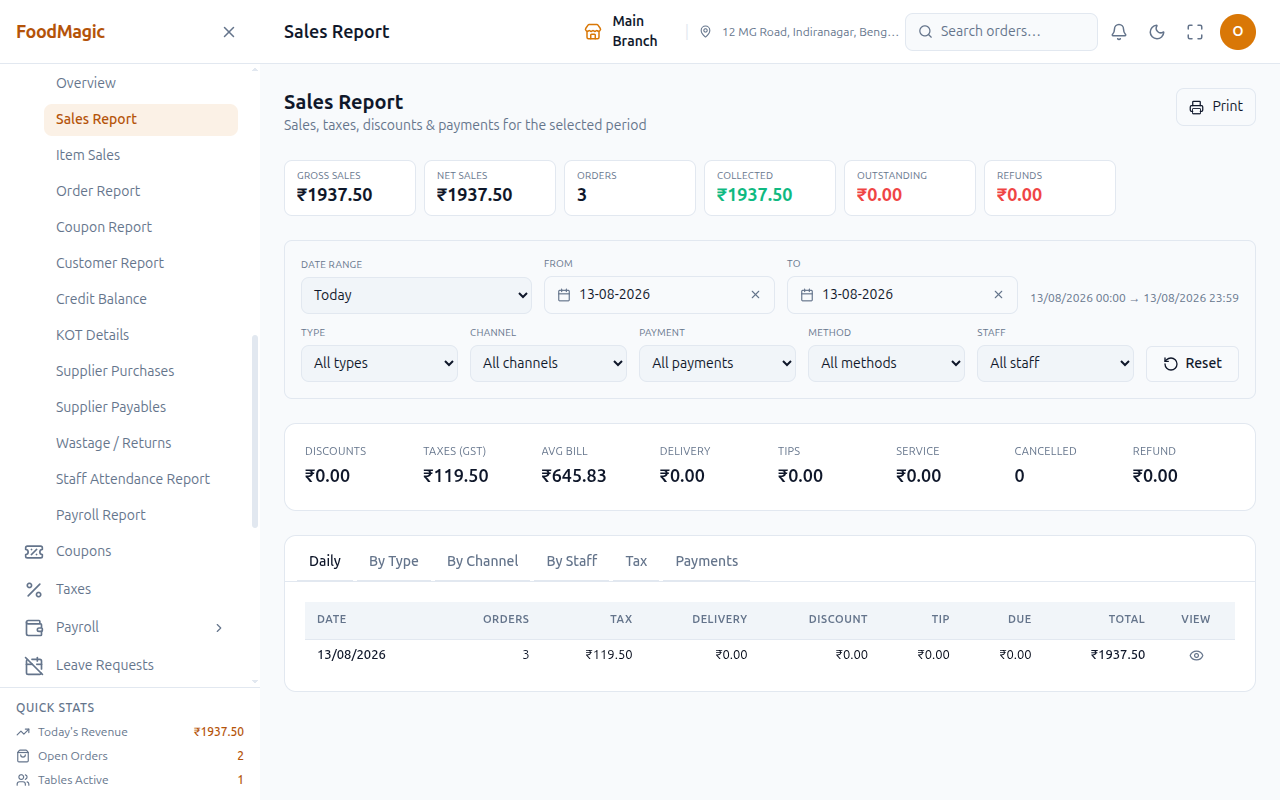
This is the daily trading summary. Pick a date, or a date range, and see the full picture of how the outlet performed.
A KPI strip at the top shows Gross Sales, Net Sales, Orders, Collected, Outstanding, and Refunds. Below that are several breakdown tables. They slice the same period by day, by order type (dine-in, takeaway, or delivery), by channel (online vs offline), and by staff member. There's also a payment-method breakdown, which calls out gateway fees on their own, and a tax breakdown split into CGST and SGST.
Each day's row has its own View button, so you can drill into that specific day.
You can filter by order type, channel, payment status, payment method, and staff member. There's also a Print button, for a paper copy at the end of a shift.
Use this at the end of the day or a shift, to answer "how did today go, and where did the money come from?" Anyone holding a sales, inventory, or staff reporting permission can see it.
Order Report — /reports/orders
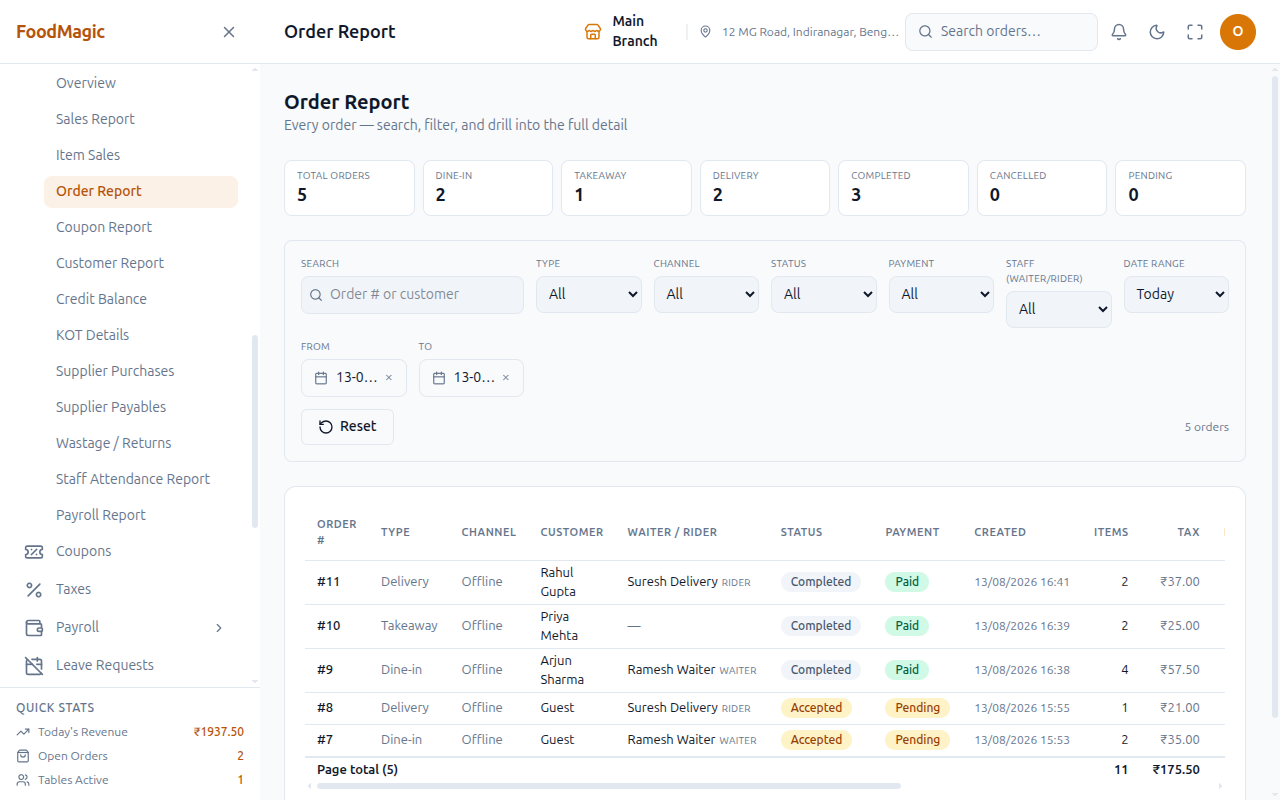
Where the Sales Report gives totals, the Order Report lists every individual order as a searchable ledger.
A KPI strip at the top shows Gross Sales, Net Sales, Orders, Collected, Outstanding, and Refunds. Below it, a table lists one row per order: order number, date and time, customer, type, channel, waiter or rider, status, payment, item count, tax, discount, coupon, credit used, total, refund, and net. A View button opens the full order.
Use this to find one specific order by number or customer, or to filter the whole order history by type, channel, status, payment, or staff member. It's the same ledger that the Orders page links out to for historical search. It also powers the day drill-down on the Sales Report, and the "View Orders" drawer on the Customer Report below.
Opening an order from this report checks a separate permission. In the unusual case where someone can see the report but not the order itself, they'll see a clear message inside the drawer instead of a blank popup.
Products
| Report | Screen | What it answers |
|---|---|---|
| Item Sales | /reports/items |
Best and least sellers, and which orders sold one |
Item Sales — /reports/items
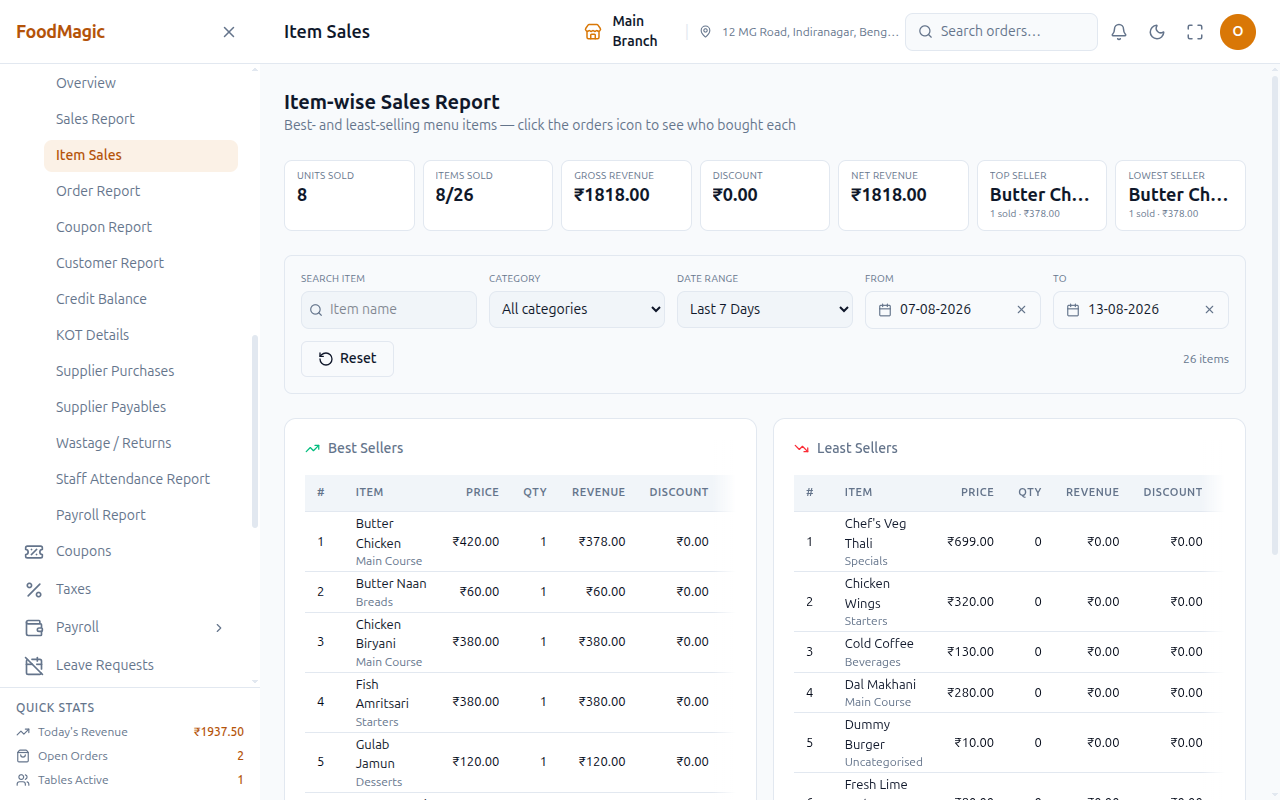
This report has two ranked tables: best sellers and least sellers. So you can see both what's moving and what's sitting untouched on the menu. Items that sold zero in the period still show up under "least sellers" — they don't just disappear.
Each row shows the item, price, quantity sold, revenue, discount, and net (revenue minus discount, so the two figures always add up). The KPI strip shows units sold, how many menu items sold at all out of the total, gross revenue, discount, and net revenue.
Filter by date range, item name, or category. Click View on any item to see exactly which completed orders it sold in. This is useful for double-checking a number, or seeing which dish is really driving sales.
This is the report for deciding what to push, what to discount, and what's quietly not selling.
Customers
| Report | Screen | What it answers |
|---|---|---|
| Customer Report | /reports/customers |
Per-customer behaviour and profile |
| Credit Balance Report | /reports/credit |
Store credit balances and movements |
| Coupon Report | /reports/coupons |
Coupon performance and who used it |
Customer Report — /reports/customers
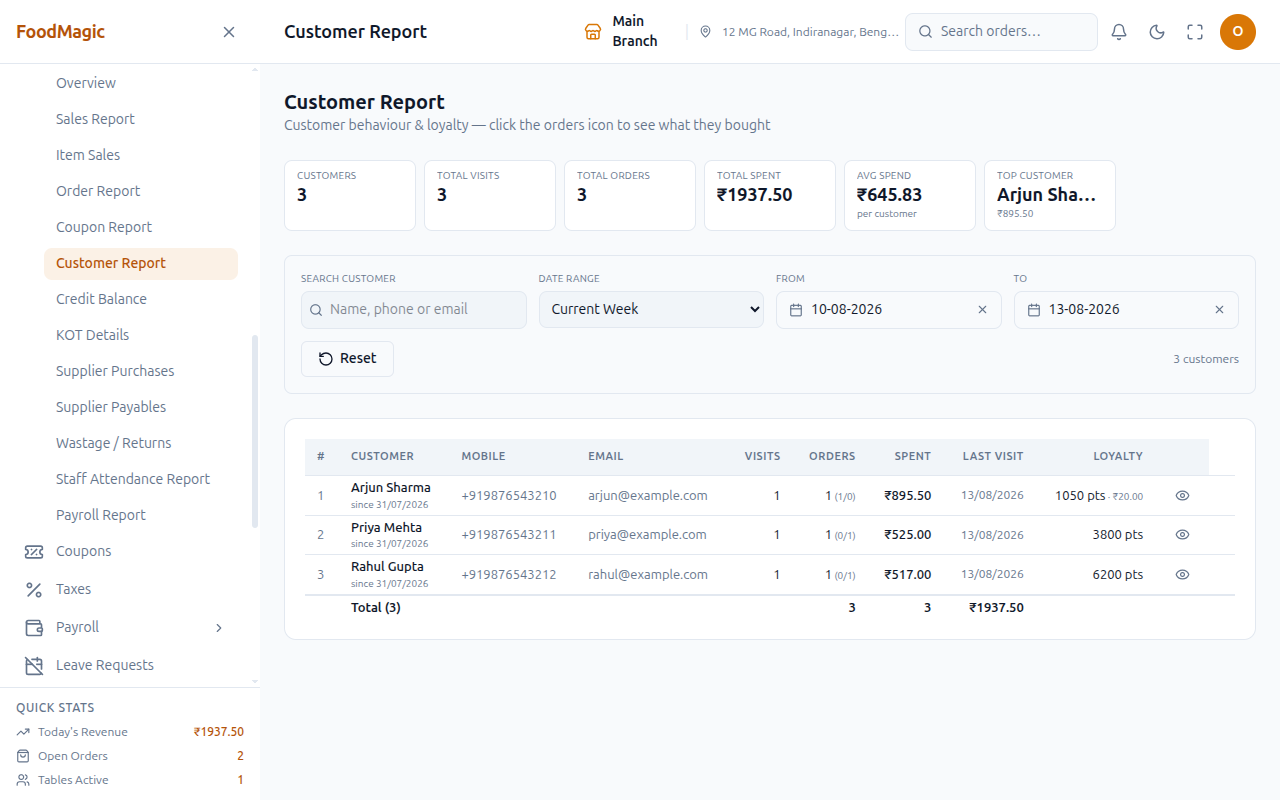
This report shows one row per customer for the period, ranked by how much they spent: name, mobile, email, number of visits, number of orders, total spent, last visit date, and loyalty points.
The KPI strip shows total customers, total visits, total orders, total spend, average spend, and the top customer for the period. Only completed orders count toward these numbers, so a cancelled or still-in-progress order never inflates anyone's totals.
Search by name, phone, or email. Click View Orders on a customer to see their order history in a drawer.
Customers belong to the brand as a whole, not to one outlet. So this report is scoped by where each order was actually placed, not by the customer's home outlet. What you see here always reflects trade at your own outlet specifically. The same rule applies to Coupons, below.
Credit Balance Report — /reports/credit
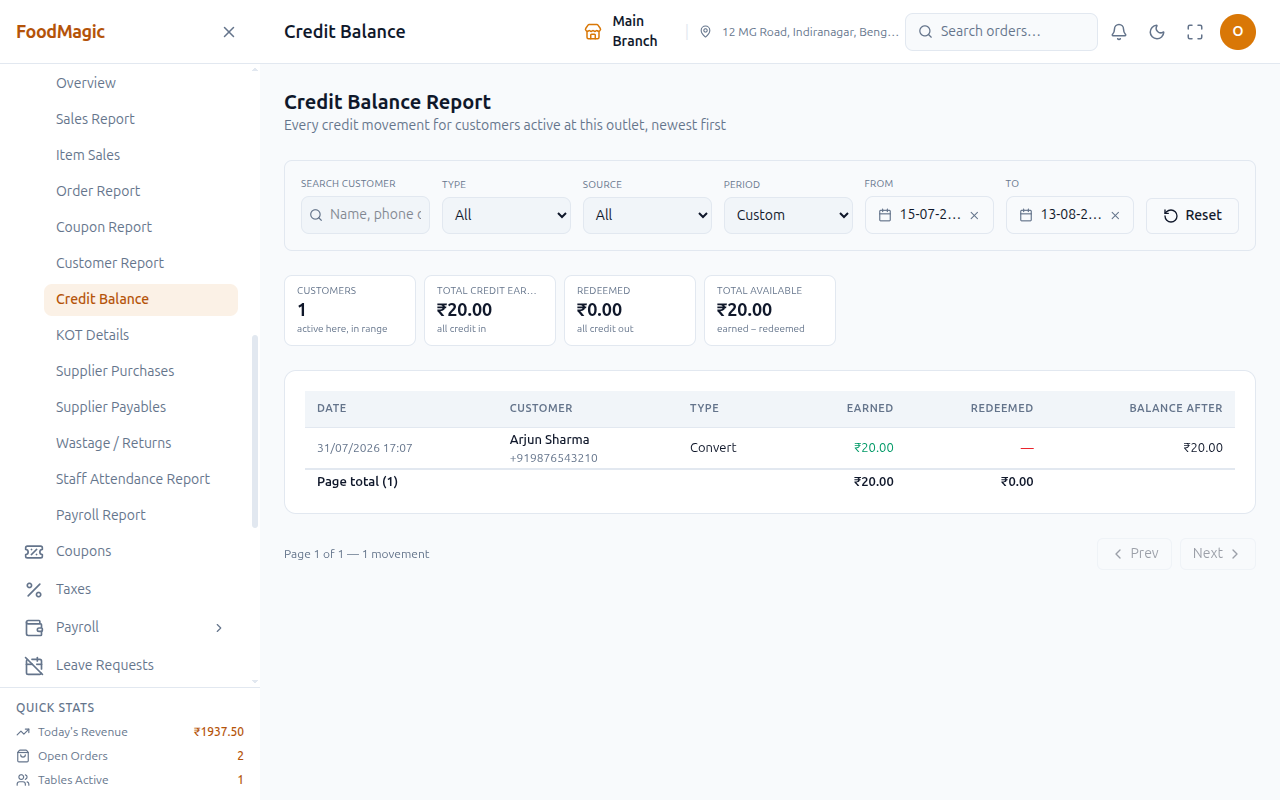
This is a ledger of every store-credit movement: date, customer, whether it was earned or redeemed, the amounts, and the running balance afterward. It's paged with Prev and Next buttons.
The KPI strip deliberately shows lifetime, brand-wide totals: customers active in the period, total credit earned, total redeemed, and total available. That way the four numbers add up as one sentence — earned minus redeemed equals available. Outlet-only figures wouldn't reconcile here, because a credit balance isn't tied to just one outlet.
Search by name, phone, or email, and click into one customer's row to see their full credit history.
Use this to check a customer's store-credit balance, or to check how much credit an outlet has issued compared to how much has been redeemed over a period. This includes credit that was issued when a refund was given back as store credit instead of cash (see Orders).
Coupon Report — /reports/coupons
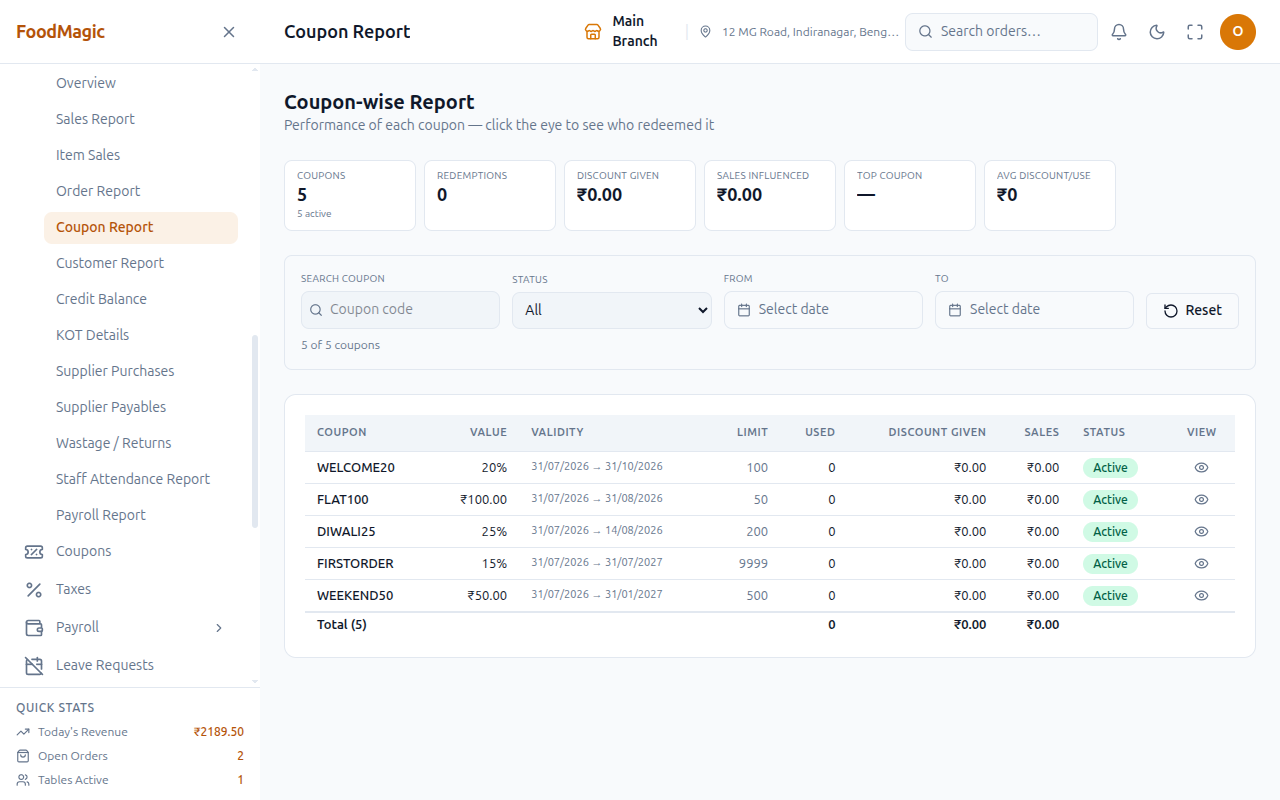
This report shows one row per coupon: the code, its value, its validity window, its usage limit, how many times it's been used, the total discount it's given, and the sales it influenced. There's a status column, and a View button drills down into every redemption.
The KPI strip covers total coupons (and how many are currently active), redemptions, discount given, sales influenced, the top-performing coupon, and the average discount per use.
Search by coupon code. Coupons, like customers, belong to the brand as a whole, not to one outlet. So "outlet-wise" here means scoping by where each redemption actually happened — that is, where the order was placed — rather than by any outlet field on the coupon itself. Coupons don't have an outlet field at all.
Use this to see whether a promotion is earning its keep, or to look up who used a specific code.
This report is deliberately hidden from platform-level administrators. It's meant for outlet-level use only. See "How it is secured" below for a related inconsistency in how that rule is applied across the reporting suite.
Staff and kitchen
| Report | Screen | What it answers |
|---|---|---|
| KOT Details Report | /reports/kot |
Kitchen tickets, per ticket or per item |
| Staff Attendance Report | /reports/attendance |
Per-staff attendance totals |
| Staff Report | /reports/staff |
Staff directory, and how many orders each person handled |
| Payroll Report | /reports/payroll |
What payroll actually paid out |
KOT Details Report — /reports/kot
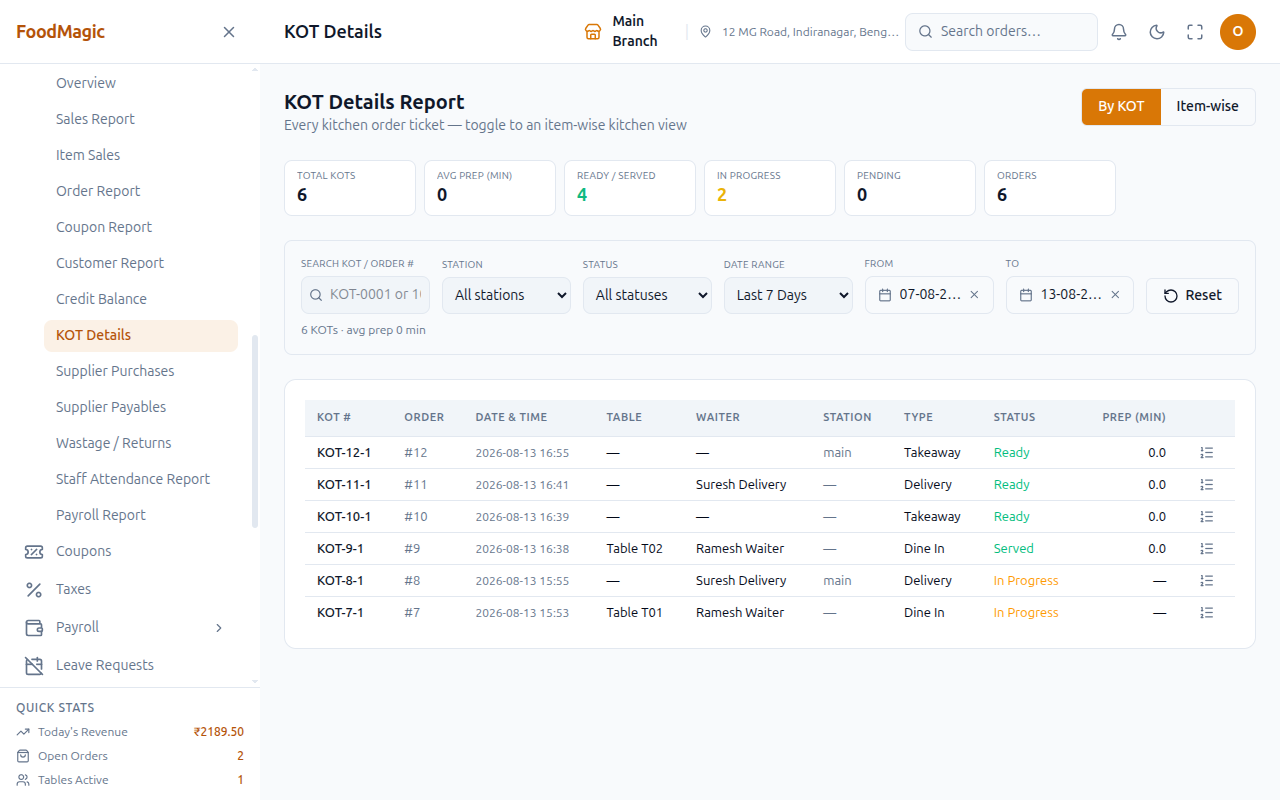
This is a historical view of kitchen tickets. You can switch between two layouts.
By KOT is the default. It shows one row per kitchen ticket: ticket number, order, date and time, station, status (voided, in progress, ready, served, or pending), and prep time in minutes. A View drawer shows exactly which items were on that ticket.
Item-wise flips the view around. It shows one row per menu item across every ticket, with quantity prepared, average prep time, and how many orders it appeared on.
Prep time is measured from when a ticket started cooking to when it was marked ready. If that hasn't happened yet, it shows as a dash instead of zero.
Filter by ticket or order number, kitchen station, ticket status, and date range. (Search and status filters don't apply in Item-wise mode.)
This report complements the live kitchen queue, which only shows what's in progress right now. Use this report to look back, spot a slow station, or check how long a dish actually takes to prepare.
Staff Attendance Report — /reports/attendance
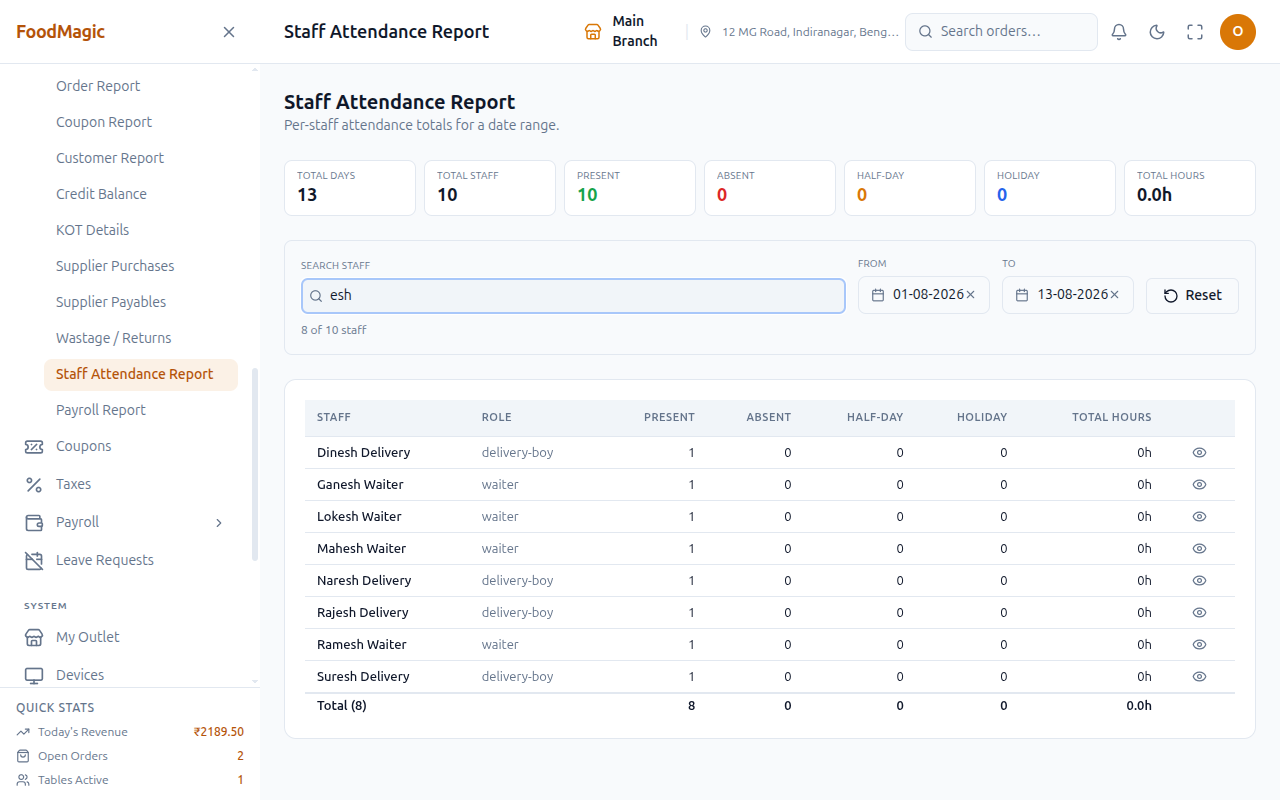
This report shows one row per staff member for the period: present days, absent days, half-days, holidays, and total hours worked. A KPI strip totals days, staff, present, absent, half-day, holiday, and total hours across the whole roster. It's the same view used on the internal staff attendance screen, which you can also reach here from Reports.
A search box filters the visible list by name, email, mobile, or role. The KPI totals, though, always stay based on the full roster for the period — they don't shift as you search. This keeps the headline numbers from jumping around mid-search.
Use this for payroll-period attendance review, or to check one person's turnout before running pay.
This is the one report that needs its own dedicated permission, instead of one of the shared reporting permissions described further down this page. Worth knowing if someone can see every other report but not this one.
Staff Report — /reports/staff
This is a staff directory with an activity count attached, not an attendance or pay view — it answers "who's on the roster, and how many orders has each person actually handled," not "who showed up" (that's Attendance, above) or "what did we pay them" (that's Payroll, below).
The KPI strip shows Total Staff, Waiters, Delivery Riders, Other Roles, Active, and Inactive — all counted across the full roster, not just the current filter. The table lists one row per staff member: name, phone, email, role, joined date, status (active/inactive), and orders handled for the selected period.
Filter by role, status, and date range, or search by name, email, phone, or role. Sorting works on name, joined date, and orders handled. Click a row to open a drill-down with that person's contact details and a list of the individual orders they handled in the period (order number, status, total).
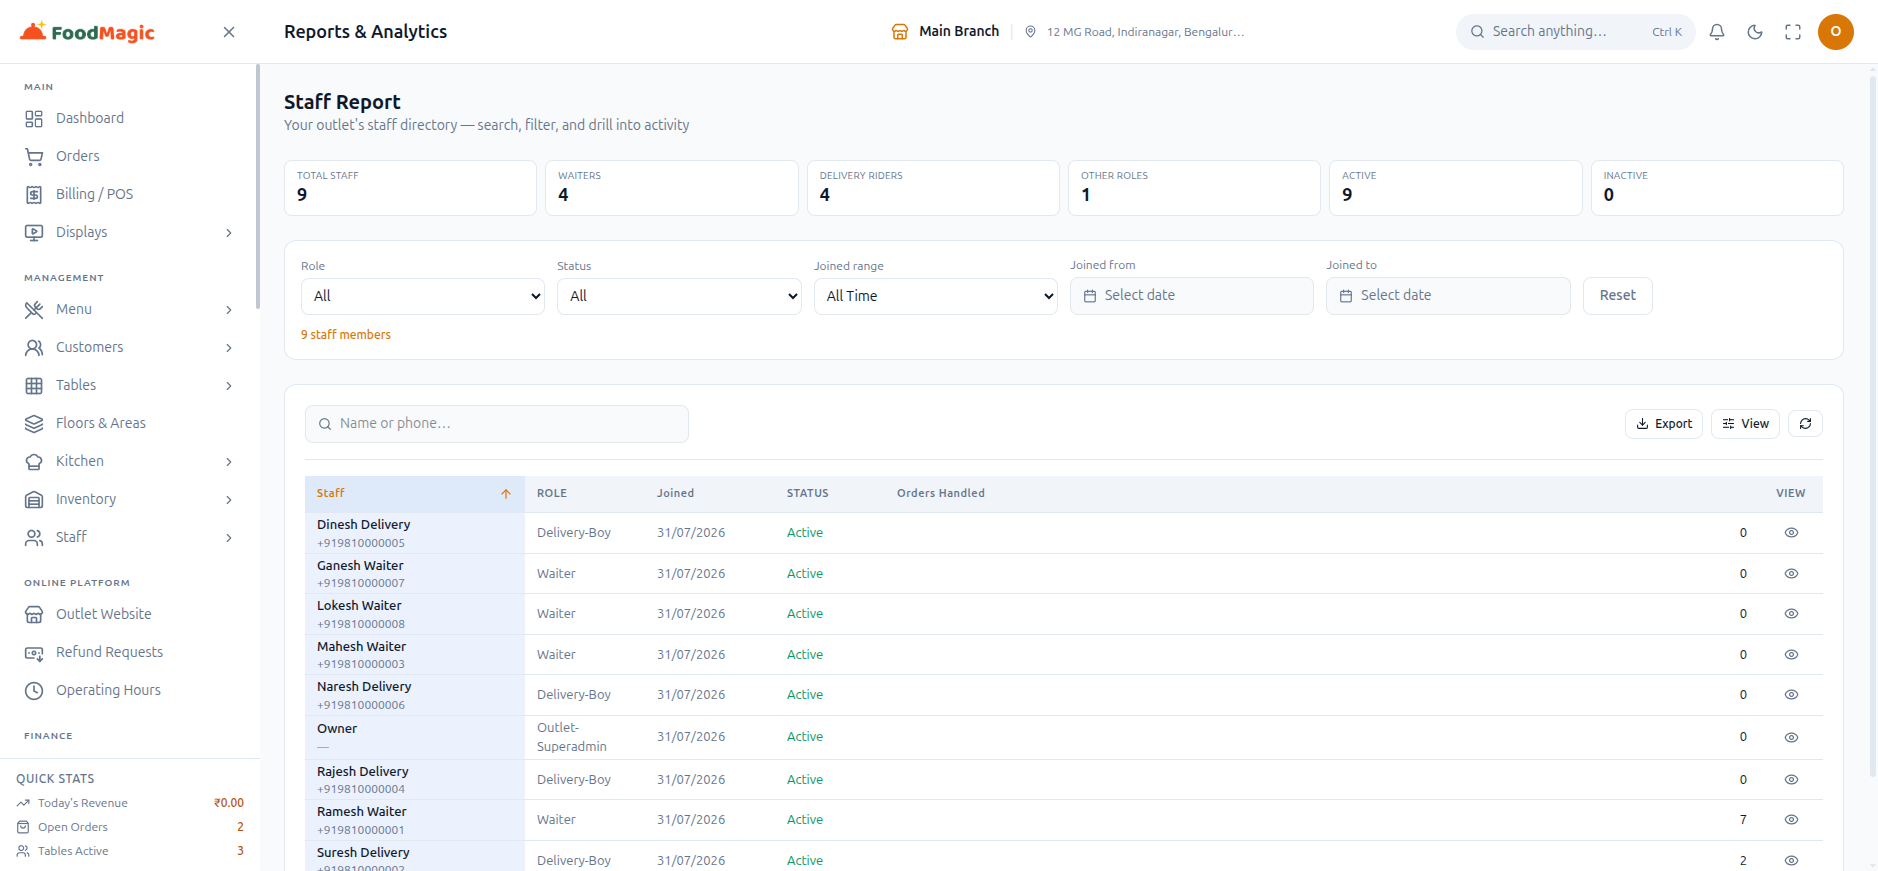
This report's date range has an extra option the rest of the suite doesn't: "All Time," which is also its default. Every other report in this suite starts on some specific window; this one starts unfiltered and shows a person's whole history until you narrow it down.
Needs a narrower permission than most of the suite. Every other outlet-level report opens for anyone holding any one of the three shared reporting rights (sales, inventory, or staff) or the export right. This one only opens for staff reporting or export — so someone who can see every sales and inventory report but holds neither of those two rights still can't open this one.
Payroll Report — /reports/payroll
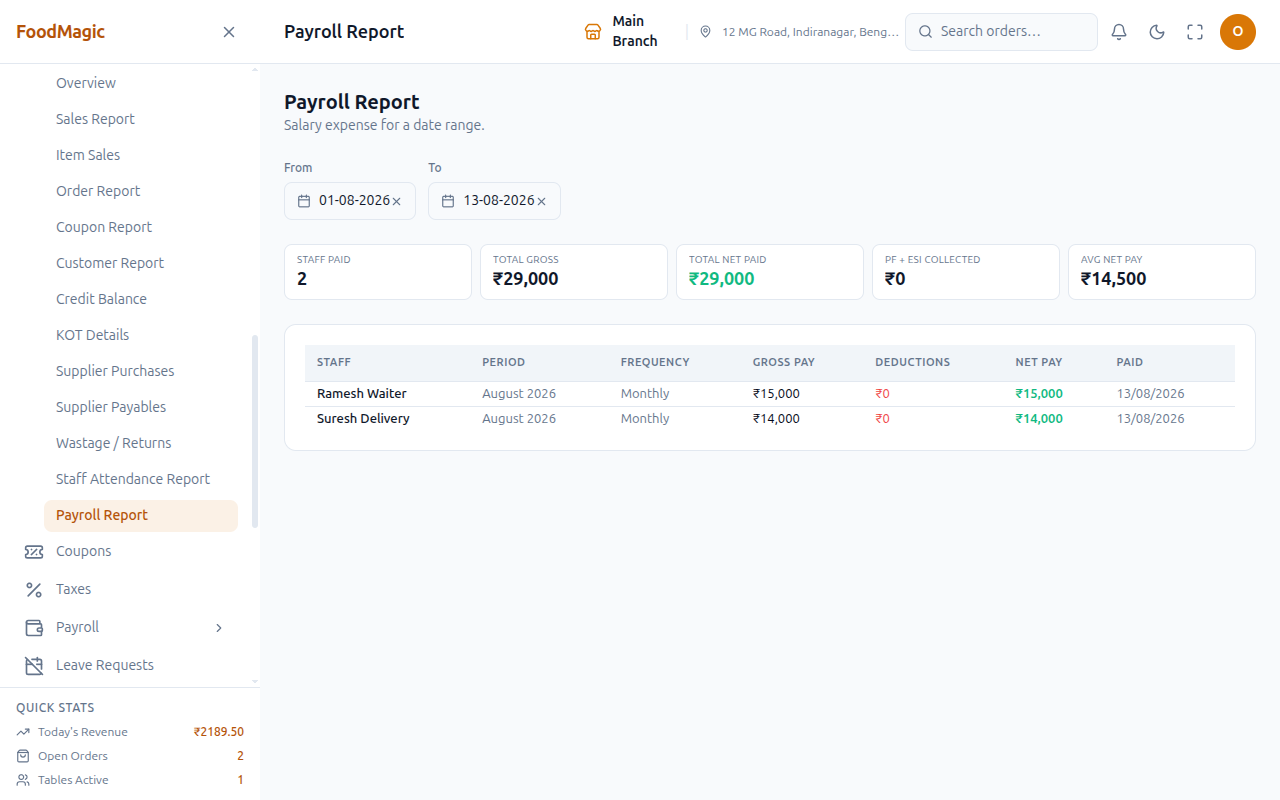
This report shows one row per paid payroll record for the period: staff member, pay period, frequency, gross pay, deductions, and net pay. The KPI strip shows staff paid, total gross, total net paid, PF and ESI collected, and average net pay. Clicking a row opens that payroll period's own page, rather than a drawer.
This answers the question "what did payroll actually cost this month?" It's a finance view, separate from the payroll workflow pages — generating, approving, and paying runs — which live outside Reports. Like Attendance above, it needs its own dedicated permission, rather than one from the shared reporting set.
Procurement
| Report | Screen | What it answers |
|---|---|---|
| Wastage / Returns Report | /reports/wastage |
Purchase returns, by reason or by date |
| Supplier-wise Purchase Report | /reports/purchases |
Period spend per supplier |
| Supplier Payables Report | /reports/payables |
Running accounts-payable balance |
Wastage / Returns Report — /reports/wastage
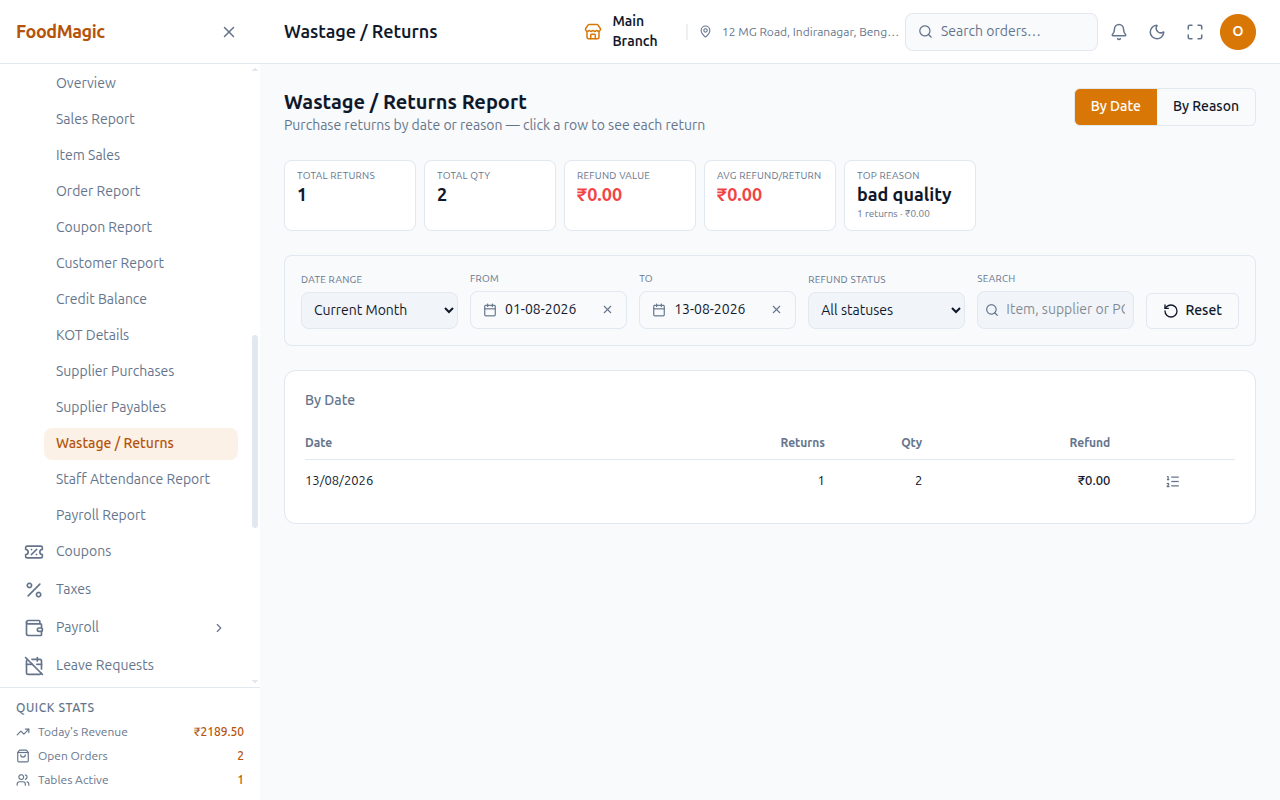
This report tracks purchase returns — goods sent back to a supplier. It does not track kitchen or prep wastage, which is a completely separate thing.
A By Date / By Reason toggle switches how results are grouped. Each grouped row drills down into the individual returns underneath: date, item, supplier, reason, purchase order number, quantity, and refund amount.
The KPI strip shows total returns, total quantity, refund value, average refund per return, and the most common reason.
Filter by date range, return reason (bad quality, wrong item, damaged, expired, excess, or other), or refund status. Or search by item, supplier, or PO number.
Use this to track recurring supplier quality problems, or to see how much refund value returns generated over a period.
Supplier-wise Purchase Report — /reports/purchases
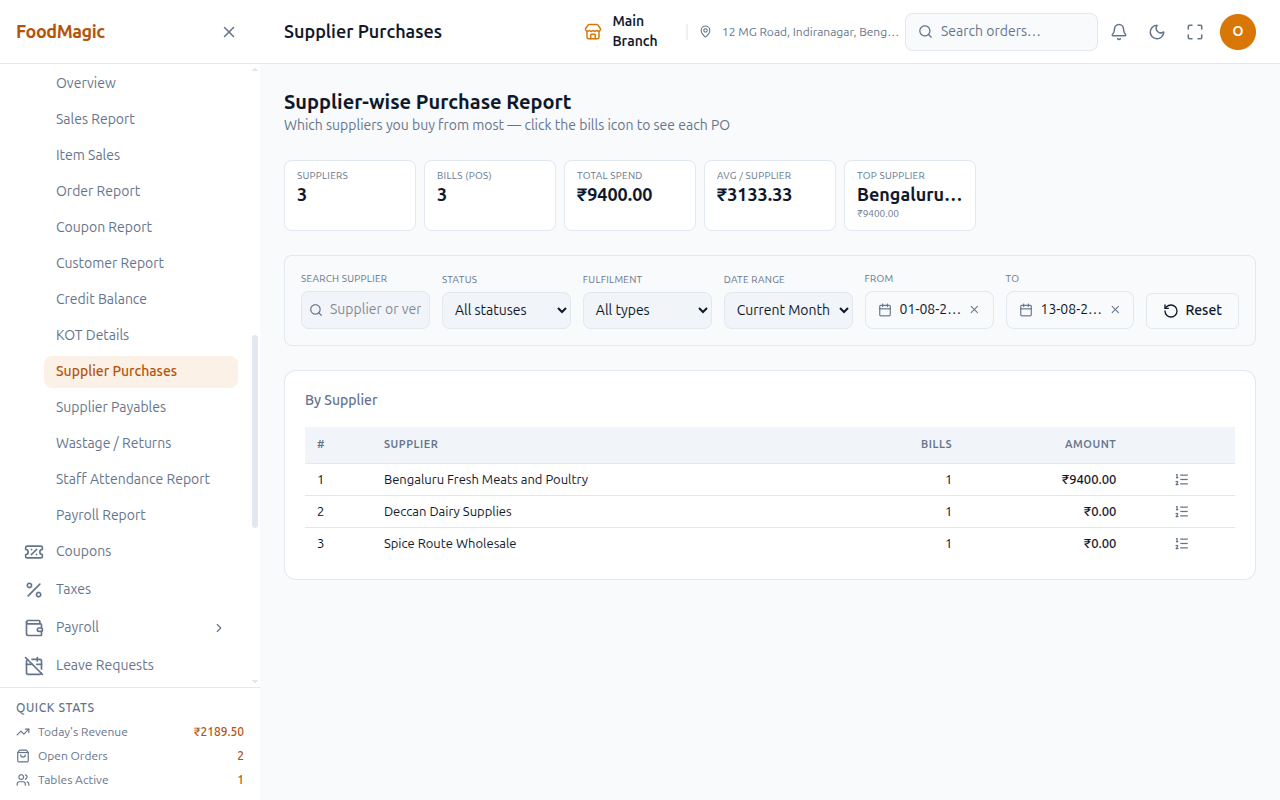
This report shows period spend per supplier: how many bills, and how much in total, ranked by amount.
This report includes free-text vendors too — purchase orders placed with a supplier who isn't in the register, grouped under whatever name was typed in. That's what separates it from the Payables report below, which doesn't include them.
The KPI strip covers suppliers, bills, total spend, average spend per supplier, and the top supplier for the period.
Search matches supplier name, including free-text vendors. You can also filter by status, fulfilment type, and date range. Click into a supplier's row to see their individual bills.
This answers "how much did we spend with each supplier this month" — a period view, as opposed to Payables' running balance below.
Supplier Payables Report — /reports/payables
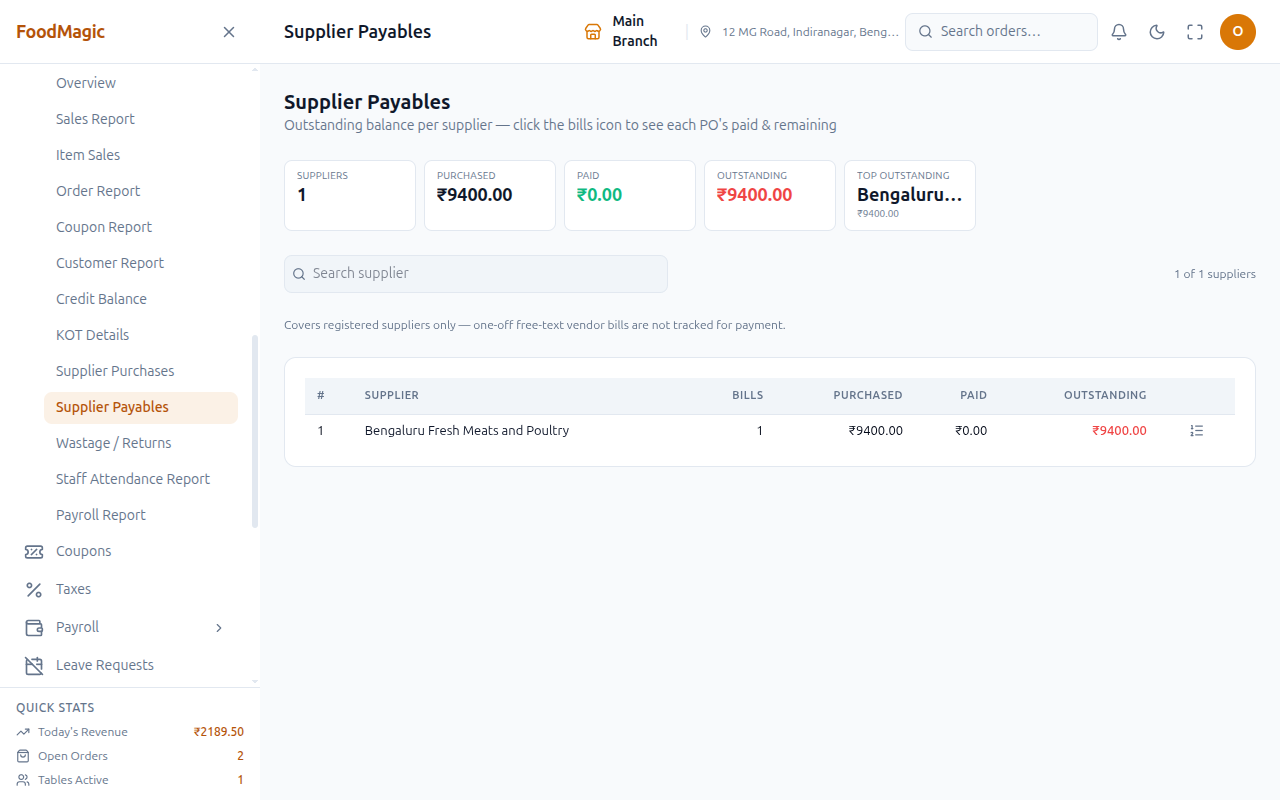
This report shows a running accounts-payable balance per supplier: how much was purchased, how much was paid, and what's still outstanding. A View bills button drills down into each supplier's bills. Unlike Purchases above, this report excludes free-text vendors, since there's no supplier record to attach a payment against.
Inside a supplier's bill drawer, payments made "on account" — meaning they're not tied to one specific purchase order — are shown separately from payments linked to a bill. An on-account payment lowers a supplier's overall outstanding balance, but it doesn't reduce any single bill's remaining amount. Because of this, the individual bill balances can add up to more than the header total. This is shown explicitly, so the numbers don't look wrong.
The KPI strip covers suppliers, purchased, paid, outstanding, and the supplier with the highest outstanding balance.
Use this to decide who to pay next, or to check one supplier's exact running balance before settling an account.
Payables and Purchases are, notably, the only two reports a brand-level administrator can currently see. Every other report is outlet-only. This is a known inconsistency — see "How it is secured" below for the full detail.
A loose end
A daily-summary view exists behind the scenes, but nothing in the app currently opens it — you can't reach it from any screen. It isn't a data or security problem, just unfinished build-out, noted here for completeness.
How the reports behave
Filters apply as soon as you change them. There's no Search button anywhere in the reporting suite — when you change a filter, the report re-runs a moment later on its own. This works the same way across every report. It was a deliberate decision, replacing an earlier design that used a Search button.
Every report screen opens with the same compact KPI strip across the top. The figures in it respond to whatever filters are currently set — they aren't fixed period totals. The strip always shows once the page has loaded, even when there are no matching rows. So an empty period shows zeros, instead of the strip disappearing.
Most reports offer a drill-down: click View on a summary row to see the underlying orders, tickets, or bills in a slide-over drawer. The one exception is the Payroll Report — clicking a row there takes you to the payroll period's own page instead of opening a drawer.
The thirteen individual report screens — everything except the Overview page, which has its own shorter set of shortcuts — share one common date-range control: Today, Current Week, Last Week, Last 7 Days, Current Month, Last Month, Current Year, Last Year, or a Custom range. Once you learn it on any one report, it works the same way on every other one. The one exception is Staff Report, which adds an All Time option and defaults to it — see its own section above.
| Screen | KPI strip |
|---|---|
/reports/daily |
Gross Sales, Net Sales, Orders, Collected, Outstanding, Refunds |
/reports/items |
Units Sold, Items Sold, Gross Revenue, Discount, Net Revenue |
/reports/orders |
Gross Sales, Net Sales, Orders, Collected, Outstanding, Refunds |
/reports/coupons |
Coupons, Redemptions, Discount Given, Sales Influenced, Top Coupon, Avg Discount/Use |
/reports/customers |
Customers, Total Visits, Total Orders, Total Spent, Avg Spend, Top Customer |
/reports/credit |
Customers, Total credit earned, Redeemed, Total available |
/reports/kot |
Total KOTs, Avg Prep, Ready/Served, In Progress, Pending, Orders (swaps to item-wise figures in Item-wise mode) |
/reports/wastage |
Total Returns, Total Qty, Refund Value, Avg Refund/Return, Top Reason |
/reports/purchases |
Suppliers, Bills (POs), Total Spend, Avg/Supplier, Top Supplier |
/reports/payables |
Suppliers, Purchased, Paid, Outstanding, Top Outstanding |
/reports/attendance |
Total Days, Total Staff, Present, Absent, Half-day, Holiday, Total Hours |
/reports/staff |
Total Staff, Waiters, Delivery Riders, Other Roles, Active, Inactive |
/reports/payroll |
Staff Paid, Total Gross, Total Net Paid, PF + ESI Collected, Avg Net Pay |
How it is secured
Here's who can see what:
| Screen | Who can open it |
|---|---|
| Overview, Sales Report, Order Report, Item Sales, Customer Report, Credit Balance, Coupon Report, KOT Details, Wastage/Returns, Supplier Purchases, Supplier Payables | Anyone holding at least one of three reporting rights — one aimed at trading figures, one at stock and procurement, one at people — or the export right. Holding just one of these four is enough to open all eleven, not only its own matching section. |
| Staff Report | Only the people reporting right or the export right — the two narrower of the four above. Someone holding only the trading-figures or stock-and-procurement right can't open this one, unlike the eleven above. |
| Staff Attendance | Its own dedicated attendance right, separate from all four above |
| Payroll | Its own dedicated payroll right, separate from all four above |
| Export CSV (Overview only) | Its own dedicated export right, separate from viewing |
Neither waiters nor delivery riders hold any reporting permission. Reports doesn't even appear in their sidebar.
Both the Super Admin and the Outlet Manager hold every reporting permission in the system. Waiters and delivery riders hold none of them.
The Overview page is the one exception worth knowing about when it comes to scope.
Every other report screen in the suite — Sales Report, Order Report, Item Sales, Customer Report, Credit Balance, Coupon Report, KOT Details, Wastage/Returns, Staff Report, Supplier Purchases, and Supplier Payables — correctly limits itself to the signed-in user's own outlet. It also scopes brand-wide data, like customers and coupons, by where the order was actually placed. So the figures on screen always reflect trade at that specific branch.
The Overview dashboard, and its Export CSV button, both limit themselves to the signed-in user's own outlet, the same way every other report in the suite does.
A platform-level administrator's account technically holds every permission there is. So most report screens are also hidden from that role directly in the navigation, rather than relying on a permission check that could never actually exclude them anyway.
Two screens — Supplier Payables and Supplier Purchases — plus the Overview page don't have that extra guard yet. So a brand-level administrator can open those three by typing the address directly, but gets redirected from the other nine.
None of the twelve report screens handle this rule in one consistent way — each page decides for itself whether to let a brand-level user in. So this can't currently be confirmed just by checking one setting, the way most other permissions in this app can be.
Whether Payables and Purchases should be visible to a brand administrator, while the rest stay outlet-only, is a genuine product question — not automatically a bug.
Reports are read-only, so there isn't much to log on the viewing side. Downloading data through Export CSV is not currently recorded in the system's audit trail. There's no record of who exported what, or when, beyond ordinary web-server traffic logs.
One smaller thing worth knowing: holding only the download permission, without any of the three viewing permissions, is enough to open a report screen's empty shell. The actual figures on it would still be blocked underneath. This isn't a data leak on its own, just slightly looser than intended.